As we've promised Kiwi TCMS is starting work on improving the legacy reports functionality. After analyzing your feedback in Issue #657 here's what we came up with. Note: screenshots below are mockups.
General tech specs
- Once a self-contained tarball is installed inside the Docker image (or inside local virtualenv) Kiwi TCMS will be able to find it automatically and update the menu options. Aka plugins. No further configuration should be necessary other than providing the source code implementing the new functionality
- Navigation menu will be able to support several layers of menus
- Where possible Telemetry pages will reuse existing HTML templates
- Telemetry data will be implemented as an RPC method that can be consumed by the front-end via JSON-RPC
- Charts will be rendered in the browser with c3/d3, see Data Visualization
Feature: Rename TestCaseRun to TestExecution
Inside Kiwi TCMS the term "test case" is used to refer to specific scenario of testing steps. A "test run" is the collection of multiple "test cases" which will be executed against a particular product build and environment.
The specific results are kept into what is now called "test case run". This will
be renamed to "test execution" (internally TestExecution class) to make it more
clear and easier to distinguish among other artifacts.
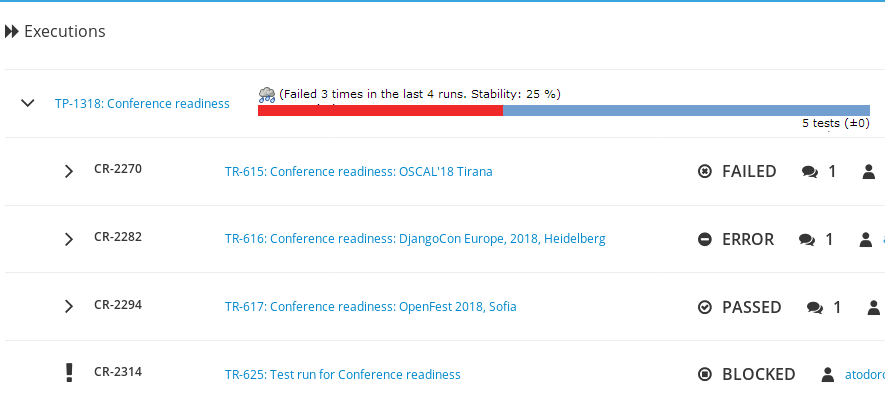
Feature: Better color coding for test execution status
As a webUI user I want to easily distinguish between PASSED, FAILED and other statuses when looking at charts and graphical visualizations.
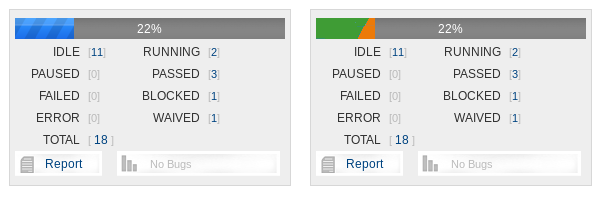
This feature request comes from the TestRun progress bar. Other charts should use the same 4 status categories and color coding standards:
- IDLE -
pf-black-600 - PASSED -
pf-green-400 - FAILED -
pf-red-100 - OTHER -
pf-orange-400. This includes other statuses which are not PASSED, FAILED and IDLE.
Here the percent value will continue to mean percent completed, aka non-IDLE.
Implementation wise the TestCaseRunStatus class defines methods for the actual icons to be used.
The same can be done for colors and this can be used directly in the HTML templates.
For color definitions see Status Palette.
Feature: Printable Test Execution Report
As a tester I want to have a nice looking TestRun execution report which I can present to my managers, stakeholders and/or customers. The page needs to be printer friendly for “Print to PDF” or print on paper!
Kiwi TCMS already has this feature. Clicking the [Report] button
in the progress widget at TR-625 presents
TestRun execution information in a simplified format found at
TR-625/Report.
In order to improve the current implementation:
- Convert TestRun page to Patternfly which generally prints better
- Add bug list at the bottom of the page, below all test execution rows
- Keep “View all in Issue Tracker” link (supported only for some bug trackers)
- The widget for TestRun progress must be kept
- Tweak CSS classes to disable printing for visual elements that we don't need. This will be decided after the entire page has been converted to Patternfly
- Remove the existing
testruns.views.TestRunReportViewand associated templates, JavaScript and CSS because they will not be needed anymore
Feature: Individual or team performance telemetry
As a manager I want to know what the work-load/performance of individual teams and engineers is. I can use this information either for performance review or for capacity planning of future work.
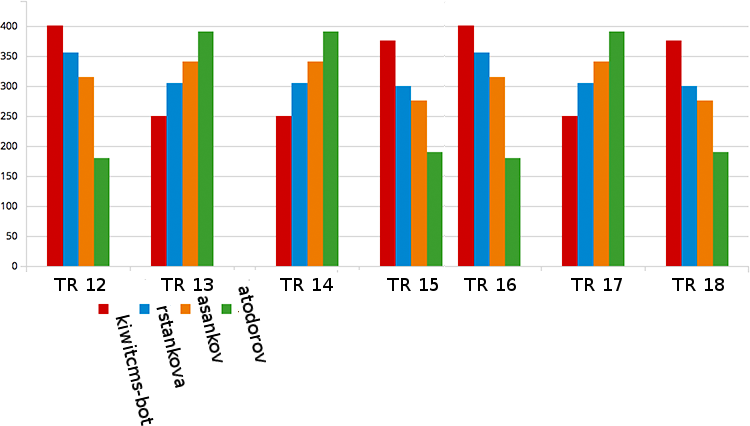
A new page will be available under TELEMETRY -> Management -> Performance which will:
- Allow filtering by
- Group (multi-select)
- User (multi select, depends on Group)
- Start / Stop dates
- Product
- Show results per User or per Group (if no users are selected)
- Allow grouping per TestRun ID or calendar week number
The backend will query TestExecution.objects and apply the selected
filters and grouping logic!
The returned data is the count of how many tests this person/team was able to execute.
Further refinement: Aggregate count by statuses (executed vs. non-executed or PASSED vs. FAILED vs. OTHER). May be represented as a stacked bar chart if grouping of series is supported.
Feature: Time-tracking telemetry
As a manager I want to know how much time it took to complete previous testing activities. I can use this information for predicting future capacity.
New page under TELEMETRY -> Management -> Time tracking.
- Filtering will be the same as performance telemetry
- Grouping will be the same as performance telemetry
- Unknown: total execution time is calculated as
- the sum of duration for each TestExecution (not available ATM, automation plugins not sending this info) or
- the total time for the entire TestRrun (not supported by automation plugins)
Visually this will be a line chart with one line for each user/group which have been selected. It will be very good if the existing chart libraries allow for a stacked line chart or a stacked area chart here!
Feature: Estimate TestRun completion time
As a test lead I want to know approximately when testing is expected to complete.
This feature will utilize time-tracking data from previous executions and display the approximated calculation in the web UI. The most obvious place for this is the TestRun progress widget (under the progress bar) or the Test Run page (near the Started at/Finished at fields).
Example text:
Started at: YYYY-MM-DD 10:38
Status: Running
Duration: 1.2 / 3 hrs
Estimated completion at: 13:30
Unknown: where does baseline duration come from? Either from the most recent TestRun or an average from all of the previous Test Runs. Note that cumulative TestRun duration is calculated between Start/Finish events while individual TestExecution records may sum up to a different value! This needs to be clarified.
Feature: TestCase health telemetry
As a tester and/or manager I want to be able to discover which TestCase(s) are the most common source of problems, that is they fail all the time or from time to time. This may indicate poor test design or bad practices when developing the product. This is also known as test stability or flaky tests!
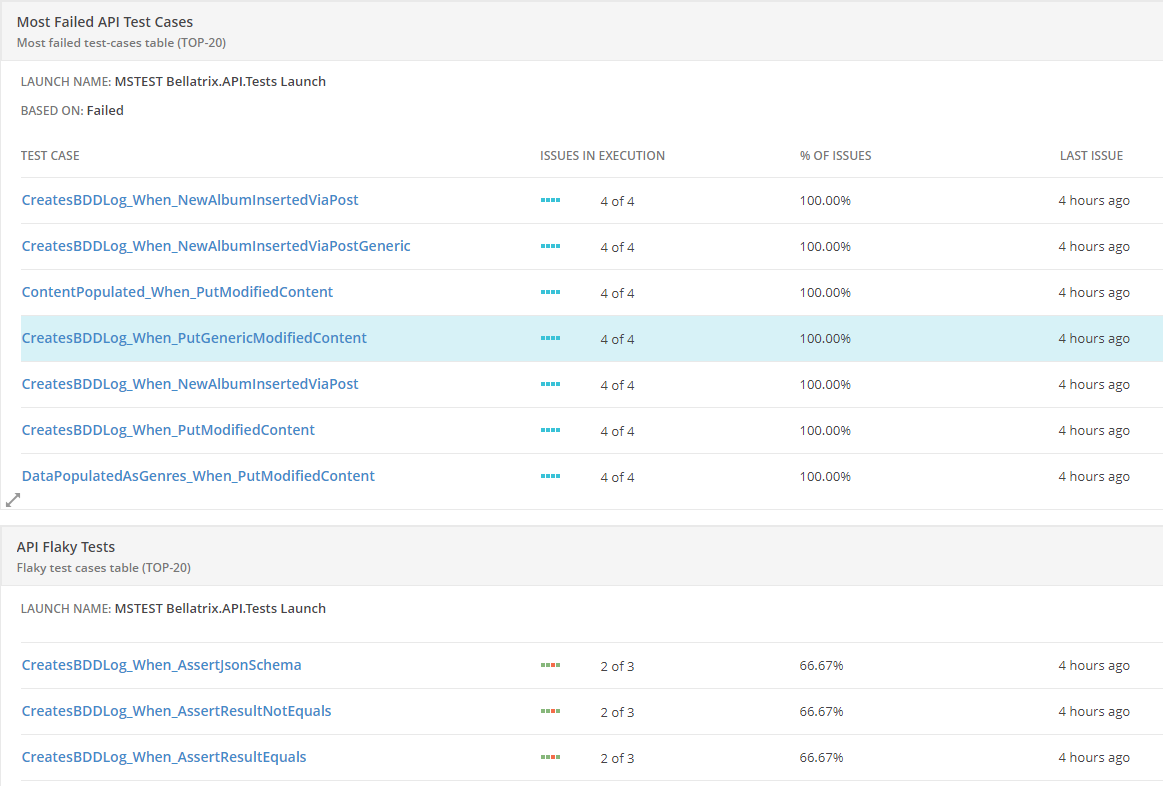
New page under TELEMETRY -> Testing -> Flaky tests
- Allow filtering by
- Product
- Test plan (refined by product)
- Start / Stop dates
- Show results in table form as shown in the image above
- PASS/non-PASS stats will be calculated based on
TestExecution.objects - 100% failing rate will be reported in the first table as ALWAYS FAILING
- Executions where failing rate is >0% and <100% will be reported as FLAKY TESTS
Feature: TestCase breakdown telemetry
As a tester and/or manager I want to see a breakdown of tests so that I have an idea how the existing tests for the product are distributed!
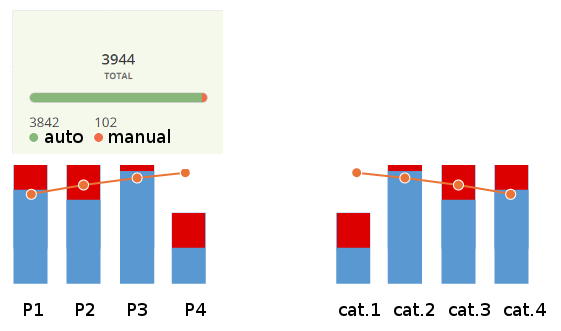
New page under TELEMETRY -> Testing -> Breakdown
- Allow filtering by
- Product
- Test plan (refined by product)
- Start / Stop dates
Shows combined bar/line charts with information about test case priorities, categories, automation status and confirmed status.
Feature: Individual TestCase health widget
As a test engineer I want to be able to quickly see health information about individual test case. This can help me visually locate TCs that need improvement so I can edit them or will help me visually judge the past history of the TC I am looking at.
This depends on the previous feature. Possible places where health status can be shown:
- Test Case page, Executions card: info per TP
- Test Run page, Test Executions table - visual icon + % to hint the user about expected TC stability
Feature: Execution trends telemetry
As a test manager I want to see information if Product builds are getting better or worse. In other words what is the trend in TestExecution number and status!
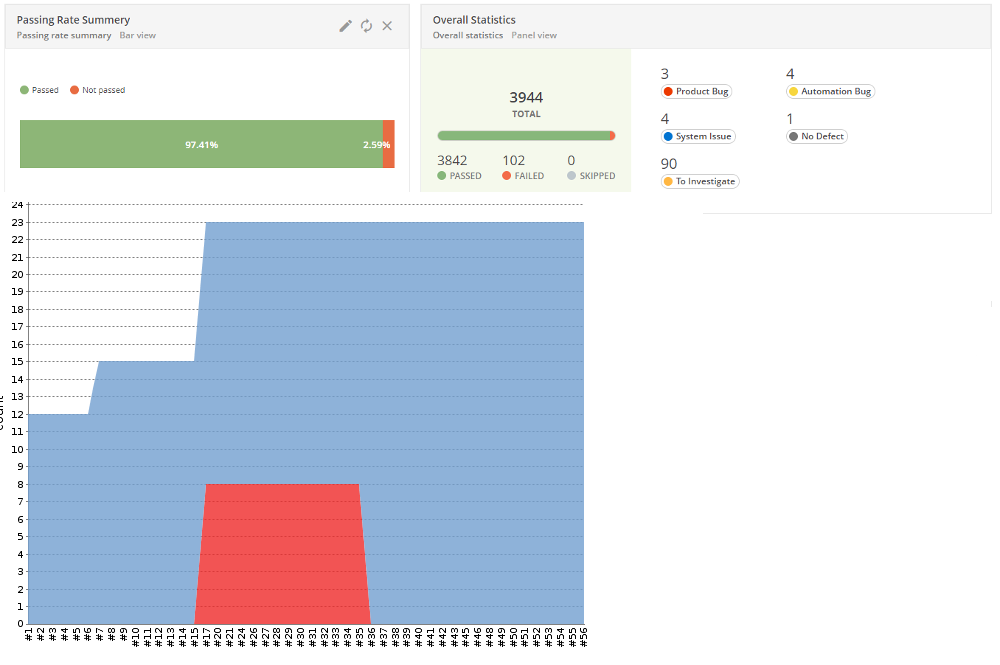
This is going to be a new page at TELEMETRY -> Testing -> Execution trends
- Filter by
- Product
- Version (refined by Product)
- Build (refined by Version)
- Test Plan (refined by Product)
- Start / Stop dates
- Shows total count of
TestExecution.objects(stacked area chart) with color codes for status - Group by TestRun ID or calendar week
You will be able to select TestRuns and/or weeks for detailed comparison.
Feature: TestRun status matrix telemetry
As a test manager I want to see detailed information about testing status for specific test run(s) or a calendar period. I also want to be able to compare the results between various weeks and/or test runs.
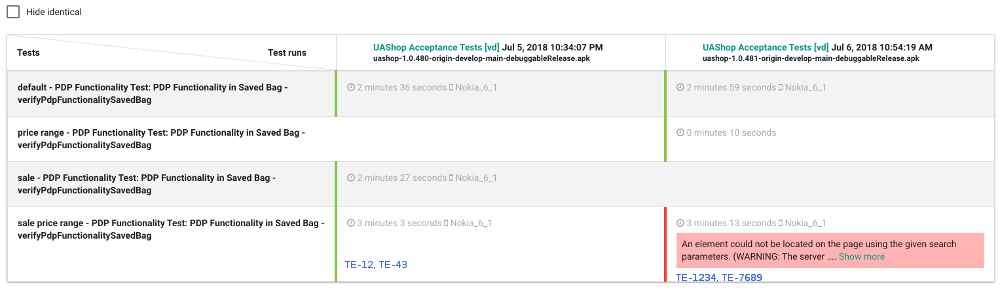
This is a continuation of Execution trends telemetry but can be used on its own as well. It will be accessible from TELEMETRY -> Testing -> Status matrix
Filtering options are the same. Results are displayed in a table format where columns are the filtered (or previously selected) TestRun objects or calendar weeks. The rows are the names of individual test cases that have been executed. If a case is missing the cell will be empty.
Cells contain color coded information about status, timestamp of execution, execution duration, links to the TestExecution object, latest comment in case of failure.
Links to bugs will be shown in each cell with a summarized bug table below the charts.
Feature: Search and compare TestRuns
This is complimentary to the TestRun status matrix feature! While searching for TestRuns in SEARCH -> Test Runs the user will be able to select several rows and proceed to compare them as described above.
Happy testing!